
AI Visibility Reports Are Here. Website Regression Reports Should Be Next
AI visibility reports explain where your brand appears in AI search. Website regression reports explain what changed on your website, when it happened, and how it affected rankings, traffic, and user experience.
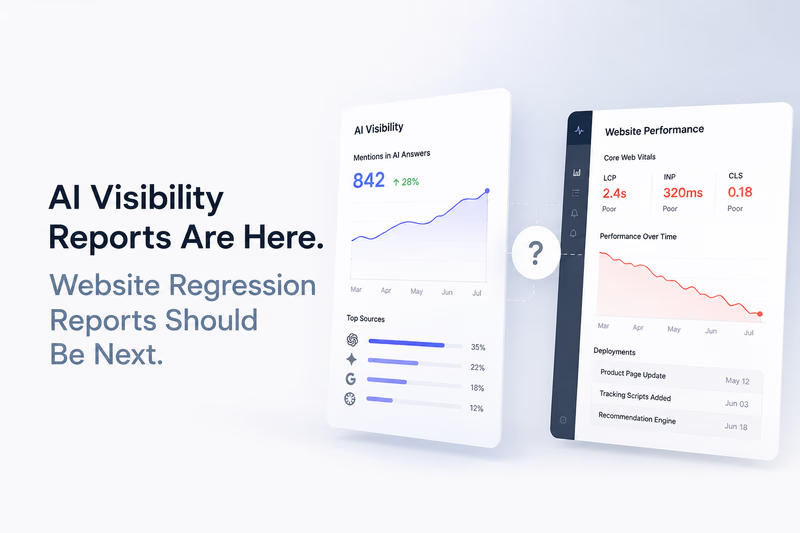
AI visibility reports tell you where your brand shows up in AI answers. Website regression reports tell you what changed on your own site, when it changed, and how it moved rankings, traffic, and Core Web Vitals. You need both. One watches the outside, the other watches the inside, and most SEO stacks now track the first while ignoring the second.
AI visibility has become one of the biggest conversations in SEO. New platforms measure how often brands appear in AI-generated answers, agencies add AI metrics to every SEO report, and clients ask whether ChatGPT, Gemini, Claude, or Google’s AI Overviews mention their products. It is a real shift, and it opens a new blind spot.
Knowing your brand appears in AI search doesn’t explain why organic traffic falls after a release. It doesn’t tell you why engagement drops while rankings hold, or why Core Web Vitals slowly slide over several weeks. AI visibility answers where your brand appears. It says nothing about what is happening on your own website.
That gap matters because modern SEO is no longer driven by rankings alone. Traffic, user experience, page speed, and technical stability all shape business results. Measuring only external visibility while ignoring internal change gives you half the picture of website health.
Why AI visibility can’t explain a traffic drop
Most automated SEO reports track familiar metrics: rankings, impressions, backlinks, indexed pages, and now AI mentions. They show what happened. They rarely explain why.
Take an ecommerce site that starts appearing more often in AI Overviews. The monthly SEO report looks positive. Keyword positions are stable or improving, and visibility keeps growing.
At the same time, developers ship a redesigned product template, marketing adds several tracking scripts, and a recommendation engine goes live across category pages. None of it moves rankings right away, but the pages get heavier and slower on mobile.
A few weeks later, conversions start falling.
Look only at rankings or AI visibility and nothing seems wrong. Look at historical performance data and the story is completely different.
Rankings tell you what happened, regressions tell you why
This is the gap many SEO teams still struggle with.
A good SEO audit can flag technical issues on the day it runs. A keyword ranking report shows which terms moved up or down. Analytics shows what happened to traffic. None of them connect a technical release to a change in user experience.
Website regression reports solve a different problem. Instead of another snapshot, they build a timeline. They show when performance started changing, which release introduced the regression, and whether that change lines up with declining traffic, lower conversions, or worse user experience. That context saves hours of investigation, because teams stop guessing and start working from evidence.
When did this page get slower?
Most discussion around Core Web Vitals fixates on passing Google’s thresholds. In practice the more useful question is simpler: when did this page become slower?
Performance problems rarely appear overnight. A single deploy almost never wrecks a whole site. Instead, dozens of small decisions change how pages behave. A new analytics platform, another personalization script, larger images, extra JavaScript, one more third-party integration, each harmless on its own. Together they produce the gradual decline users feel long before anyone opens the next report.
That is why historical monitoring matters. A Lighthouse score taken today is useful. Comparing it against three months of data is far more useful, because it shows a trend instead of an isolated number. It is also why web performance monitoring beats one-time audits when you are trying to understand how technical change affects SEO over time.
What the next SEO report should show
The future of SEO reporting isn’t more dashboards. Most teams already have enough of those. The opportunity is connecting data that currently sits in separate tools.
Picture one report showing that AI visibility rose after a content update, CTR held steady, rankings improved, but mobile performance dropped right after a frontend deploy. Instead of switching between Search Console, Lighthouse, analytics, and release notes for hours, the whole story sits in one place. That is far more useful than another spreadsheet of keyword positions.
Whether you use free SEO reporting software, download a one-off SEO audit report, or review enterprise dashboards, the principle holds. Individual metrics are useful, but understanding how they influence each other is where real SEO decisions get made.
AI visibility reports are just the beginning
AI visibility reports are a genuine step forward. They measure something that didn’t exist a year ago, and they help marketers see how brands show up inside AI search and how that changes over time.
The next step is applying the same thinking to the website itself. Instead of only asking whether AI mentions your brand, SEO teams should know when performance changed, which release caused a regression, how Core Web Vitals evolved, and whether those changes touched traffic or conversions. That is the difference between one more dashboard and a report that actually explains the drop.
AI visibility reports are already part of every modern SEO workflow.
Website regression reports should be next.